Day 30: Basic image analysis with MATLAB’s regionprops

If you’re lucky enough to have imaging data that you can analyze without turning to contemporary machine learning approaches or you just need a first pass, MATLAB’s regionprops is a handy tool with a lot of functionality.
Today I’ll show how you can combine some of the
First let’s make a semi-realistic looking microscopy image:
rng(5);
Nspots = 300;
f = randi(300,[Nspots,2]);
myimage = accumarray(f,normrnd(100,100,[Nspots,1]),[300,300]);
myimage = imfilter( myimage, fspecial('gaussian',20,3) ) + poissrnd(1,300);
The next step is to threshold the image and eliminate any stray particles:
threshold = range(range(myimage)).*graythresh(myimage);
thresholded = myimage > threshold;
thresholded = bwareaopen( thresholded, 5 );
The last step of the analysis involves regionprops, which outputs a structure array. This is pretty useless unless you have a clever way of getting the data out. We’ll use struct2table.
myrois = regionprops( thresholded, myimage,...{'Centroid','MeanIntensity','Area'} );myroi_table = struct2table( myrois );
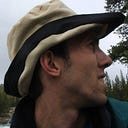
At this step, it’s pretty much up to you what you want to do with your table. Group it, rank it, sort it! In the banner image above, I create a scatter plot that represents each ROI as a circle with a diameter equal to the ROI’s area, and each circle is colored based on the mean intensity of the ROI from which it came. Here is a gist showing completely how that was done:
Create a density map using pdist2
Since we have the centroid distances, we might as well use them to calculate a density map from our image. To do this, we use the pdist2 function which calculates the pairwise distance between every element in two sets of (x,y) values. We input our centroids twice to return a matrix with Euclidean distances between them:
D = pdist2(myroi_table.Centroid,myroi_table.Centroid);The diagonal entries measure the distance between an ROI and itself, so we needn’t include them in our analysis. We’ll set them to NaN so we can instead compute the minimum value (which is the distance from each ROI to its closest neighbor).
D(D==0) = nan;min_distances = min( D, [], 1 );
You can then use a scatterplot once again to highlight ROIs with nearby neighbors.
scatter( myroi_table.Centroid(:,1), myroi_table.Centroid(:,2), myroi_table.Area, min_distances, 'filled' );By adding a colorbar you can see the distances for each ROI.

The possibilities for using regionprops are pretty limitless and can be crafted for many different applications. Hope these two examples give you some inspiration to get started on your own custom image analysis projects.